4.5.3. Comparative Evaluation
To conduct a comparative analysis of each configuration, the best-performing version from each model was selected. This approach allowed for a focused assessment of the optimal outputs without introducing unnecessary complexity.
Notably, the inference effort was omitted from this comparison, as it rarely demonstrated significant variations in output quality across different models.
In the assessment, each configuration was ranked on a scale from 1 to 4, with higher numbers indicating better performance.
Results benchmarks
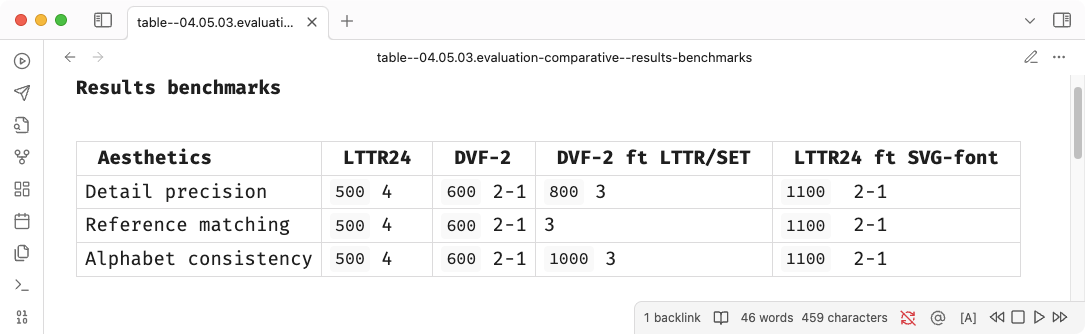
In the evaluation of effort, the LTTR24 base achieved superior
precision compared to other results with minimal training of just 300
epochs, which suggests that a regularised dataset provides superior
conditions. However, its performance in matching the reference style was
inconsistent, as it struggled to generate larger letter apertures in
characters such as a, e, and
c.
In contrast, the LTTR24 base fine-tuned on the SVG-font dataset (Lopes et al. 2019)—trained extensively across 1200 epochs—produced noticeably less plausible results. While one might conclude that “the most trained models perform the worst,” this does not necessarily imply that increased effort directly causes lower quality. The incremental improvements between 1000 and 1100 epochs indicate that factors beyond mere training epochs likely contributed to quality issues.
The original DeepVecFont-2 (Wang et al. 2023) model showed similar quality issues, pointing instead to dataset size and quality as more significant contributors. Supporting this, the DeepVecFont-2 model fine-tuned on the LTTR/SET, which is normalised, consistently delivered better results. Thus, we conclude that dataset characteristics are likely central to optimising model performance.
